
To spit data into a training set and test set, you had indeed used the train_test_split library from scikit learn. There are some parameters in train_test_split like random_state, stratify, shuffle, test_size, etc.
Here we will talk about one parameter called stratify in train_test_split in a simple way. Basically, we use stratify to create an unbiased dataset when you have a biased dataset.
Why Stratify?
Suppose we have data and if that data is biased then we can have to use stratify to overcome train_test_split’s biased random sampling problem. Due to this sampling problem, the model will perform very poorly and cause problems like overfitting or underfitting. To Overcome we have to use stratify.
Understand it with the Example:
Let’s understand what it means by example:
Here I have taken a sample data which has 20 columns and in which The Output Columns Consist of 16 Yes and 4 No. As you can see, this data consists of an 80/20 distribution. Hence biased data is present here.
import pandas as pd
import numpy as np
from sklearn.model_selection import train_test_split
df=pd.read_csv("/content/sample - Sheet1(1).csv")
print(df)
print("---------")
df['Output'].value_counts()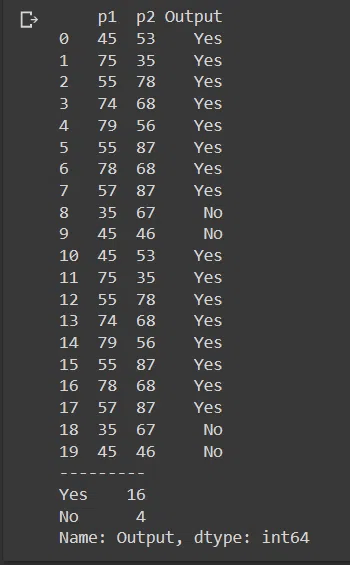
Let’s split the data using train_test_split and see how our data is being split without stratify parameter.
X=df.drop('Output',axis=1)
Y=df['Output']
X_train,X_test,y_train,y_test=train_test_split(X,Y,random_state=101)
print(y_train.value_counts())
print("\n")
print(y_test.value_counts())
Here you can clearly see that y_train contains 11 Yes and 4 No. And y_test contains ONLY 5 Yes. If we provide this data to the model then the model’s performance will be poor.
To overcome this problem, we have to use stratify parameter while splitting data. This parameter is only taking the output label as an argument So we have to pass the Y set. Let’s see this in action.
X_train,X_test,y_train,y_test=train_test_split(X,Y,random_state=101,stratify=Y)
print(y_train.value_counts())
print("\n")
print(y_test.value_counts())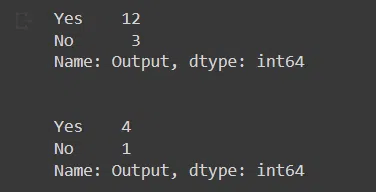
See how our prediction labels are separated in y_train and y_test by the same ratio which is 4:1 in our case. Now you can use this unbiased data for further processing.